Witchcraft as Contagion
When accusing a witch looks a lot like spreading a disease
In 1692, a contagion was spreading through the the area of Salem, Massachussetts. But instead of a biological pathogen, it was a social one: Accusations of witchcraft.
By analyzing who pointed at whom, we can see how the accusations spread through the community. And when you look at the structure of the network, it looks a lot like the outbreak of a disease.
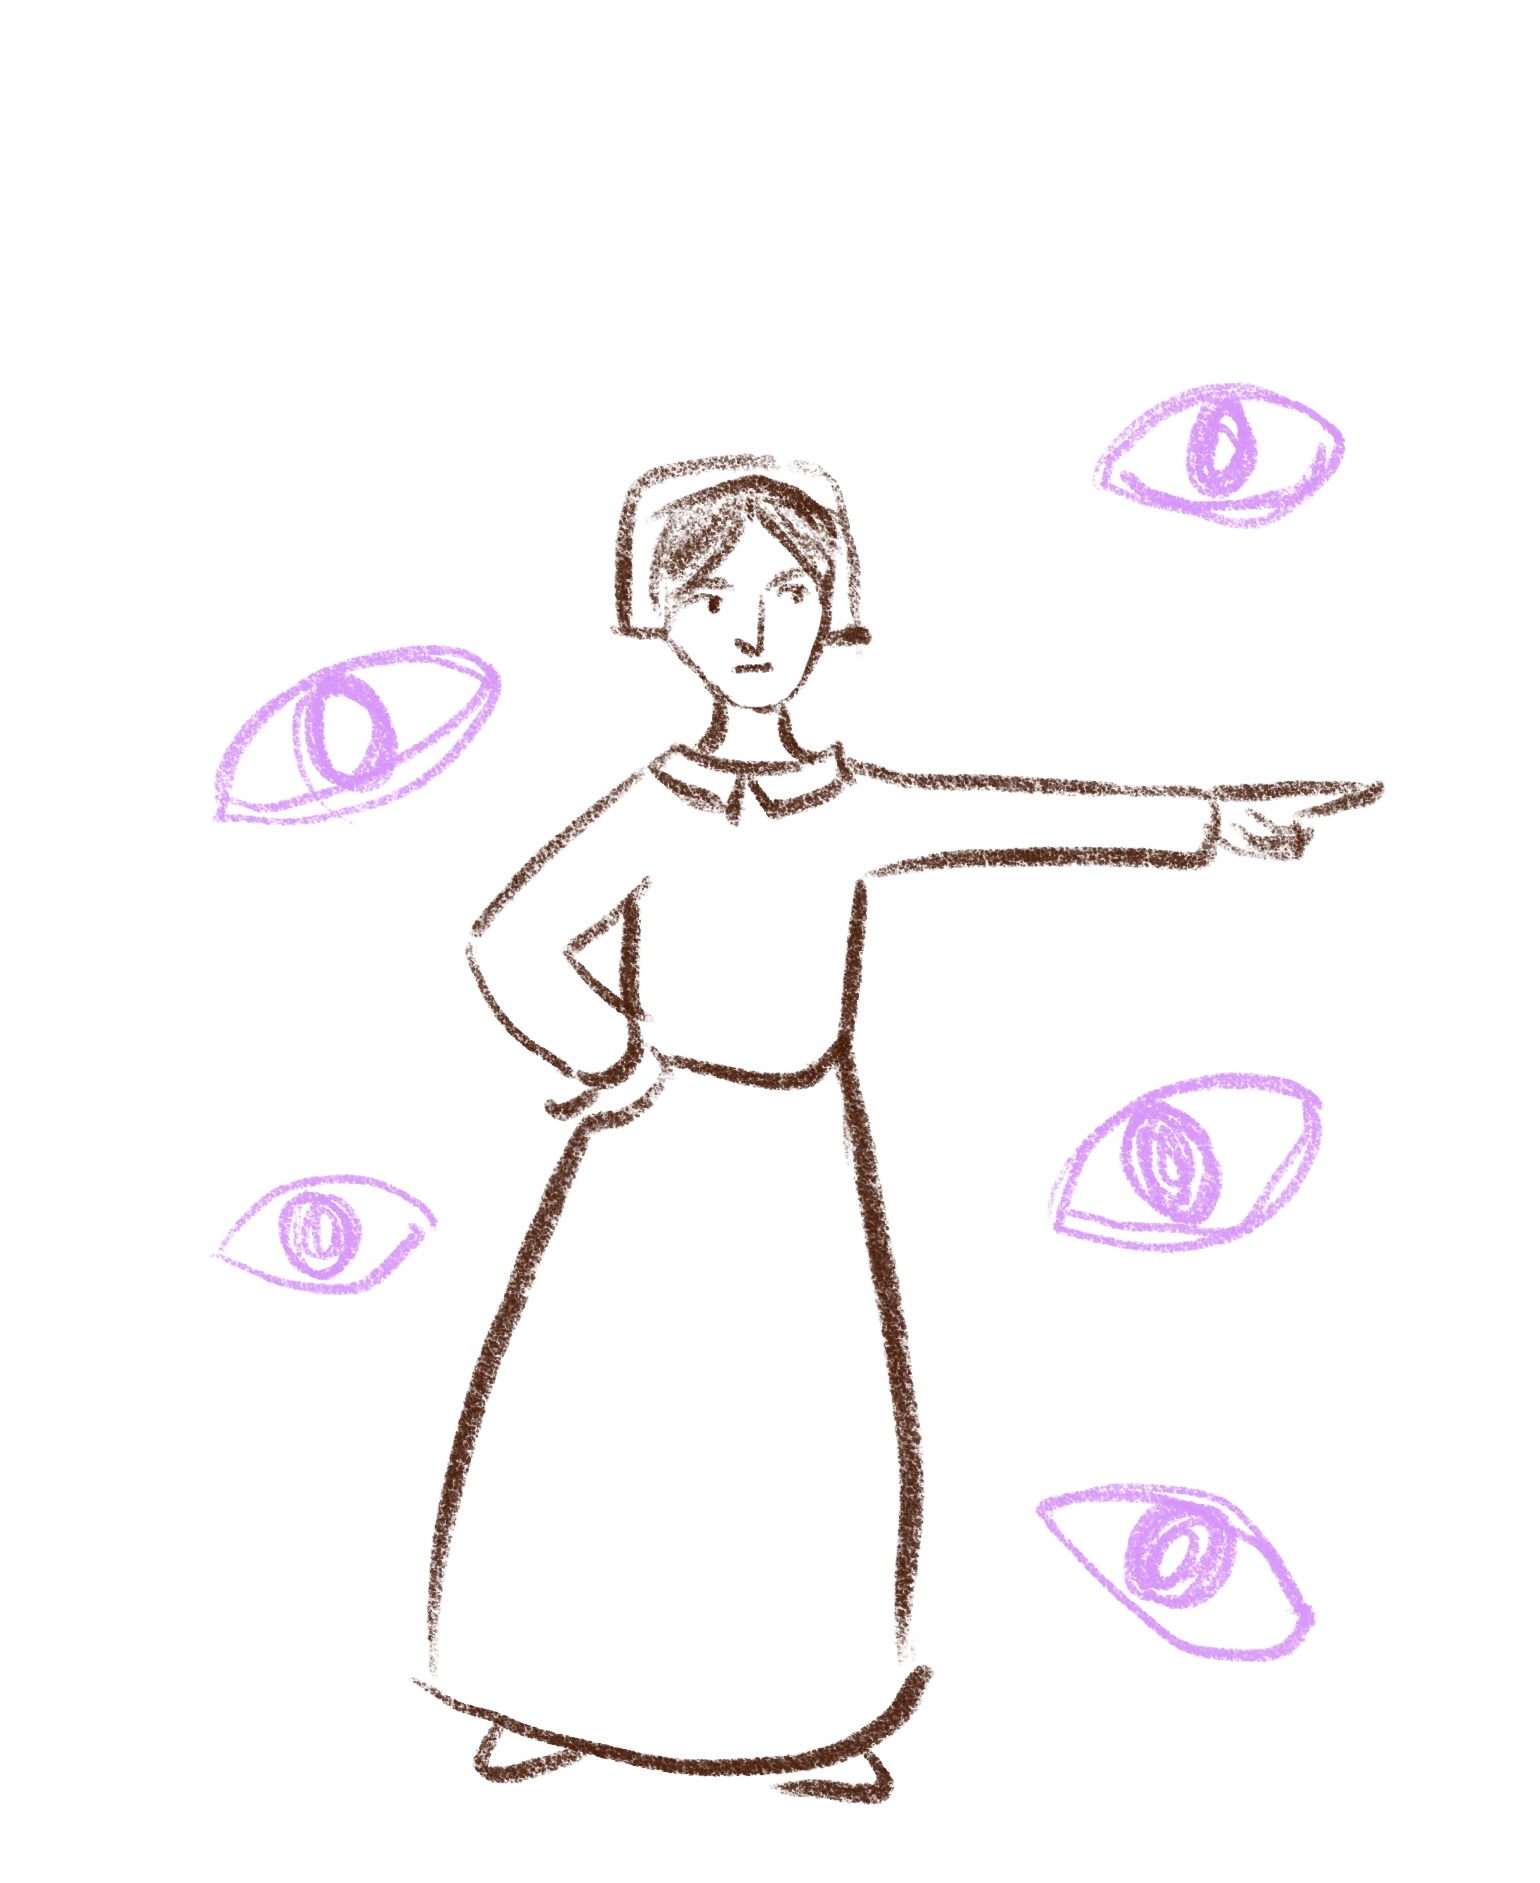
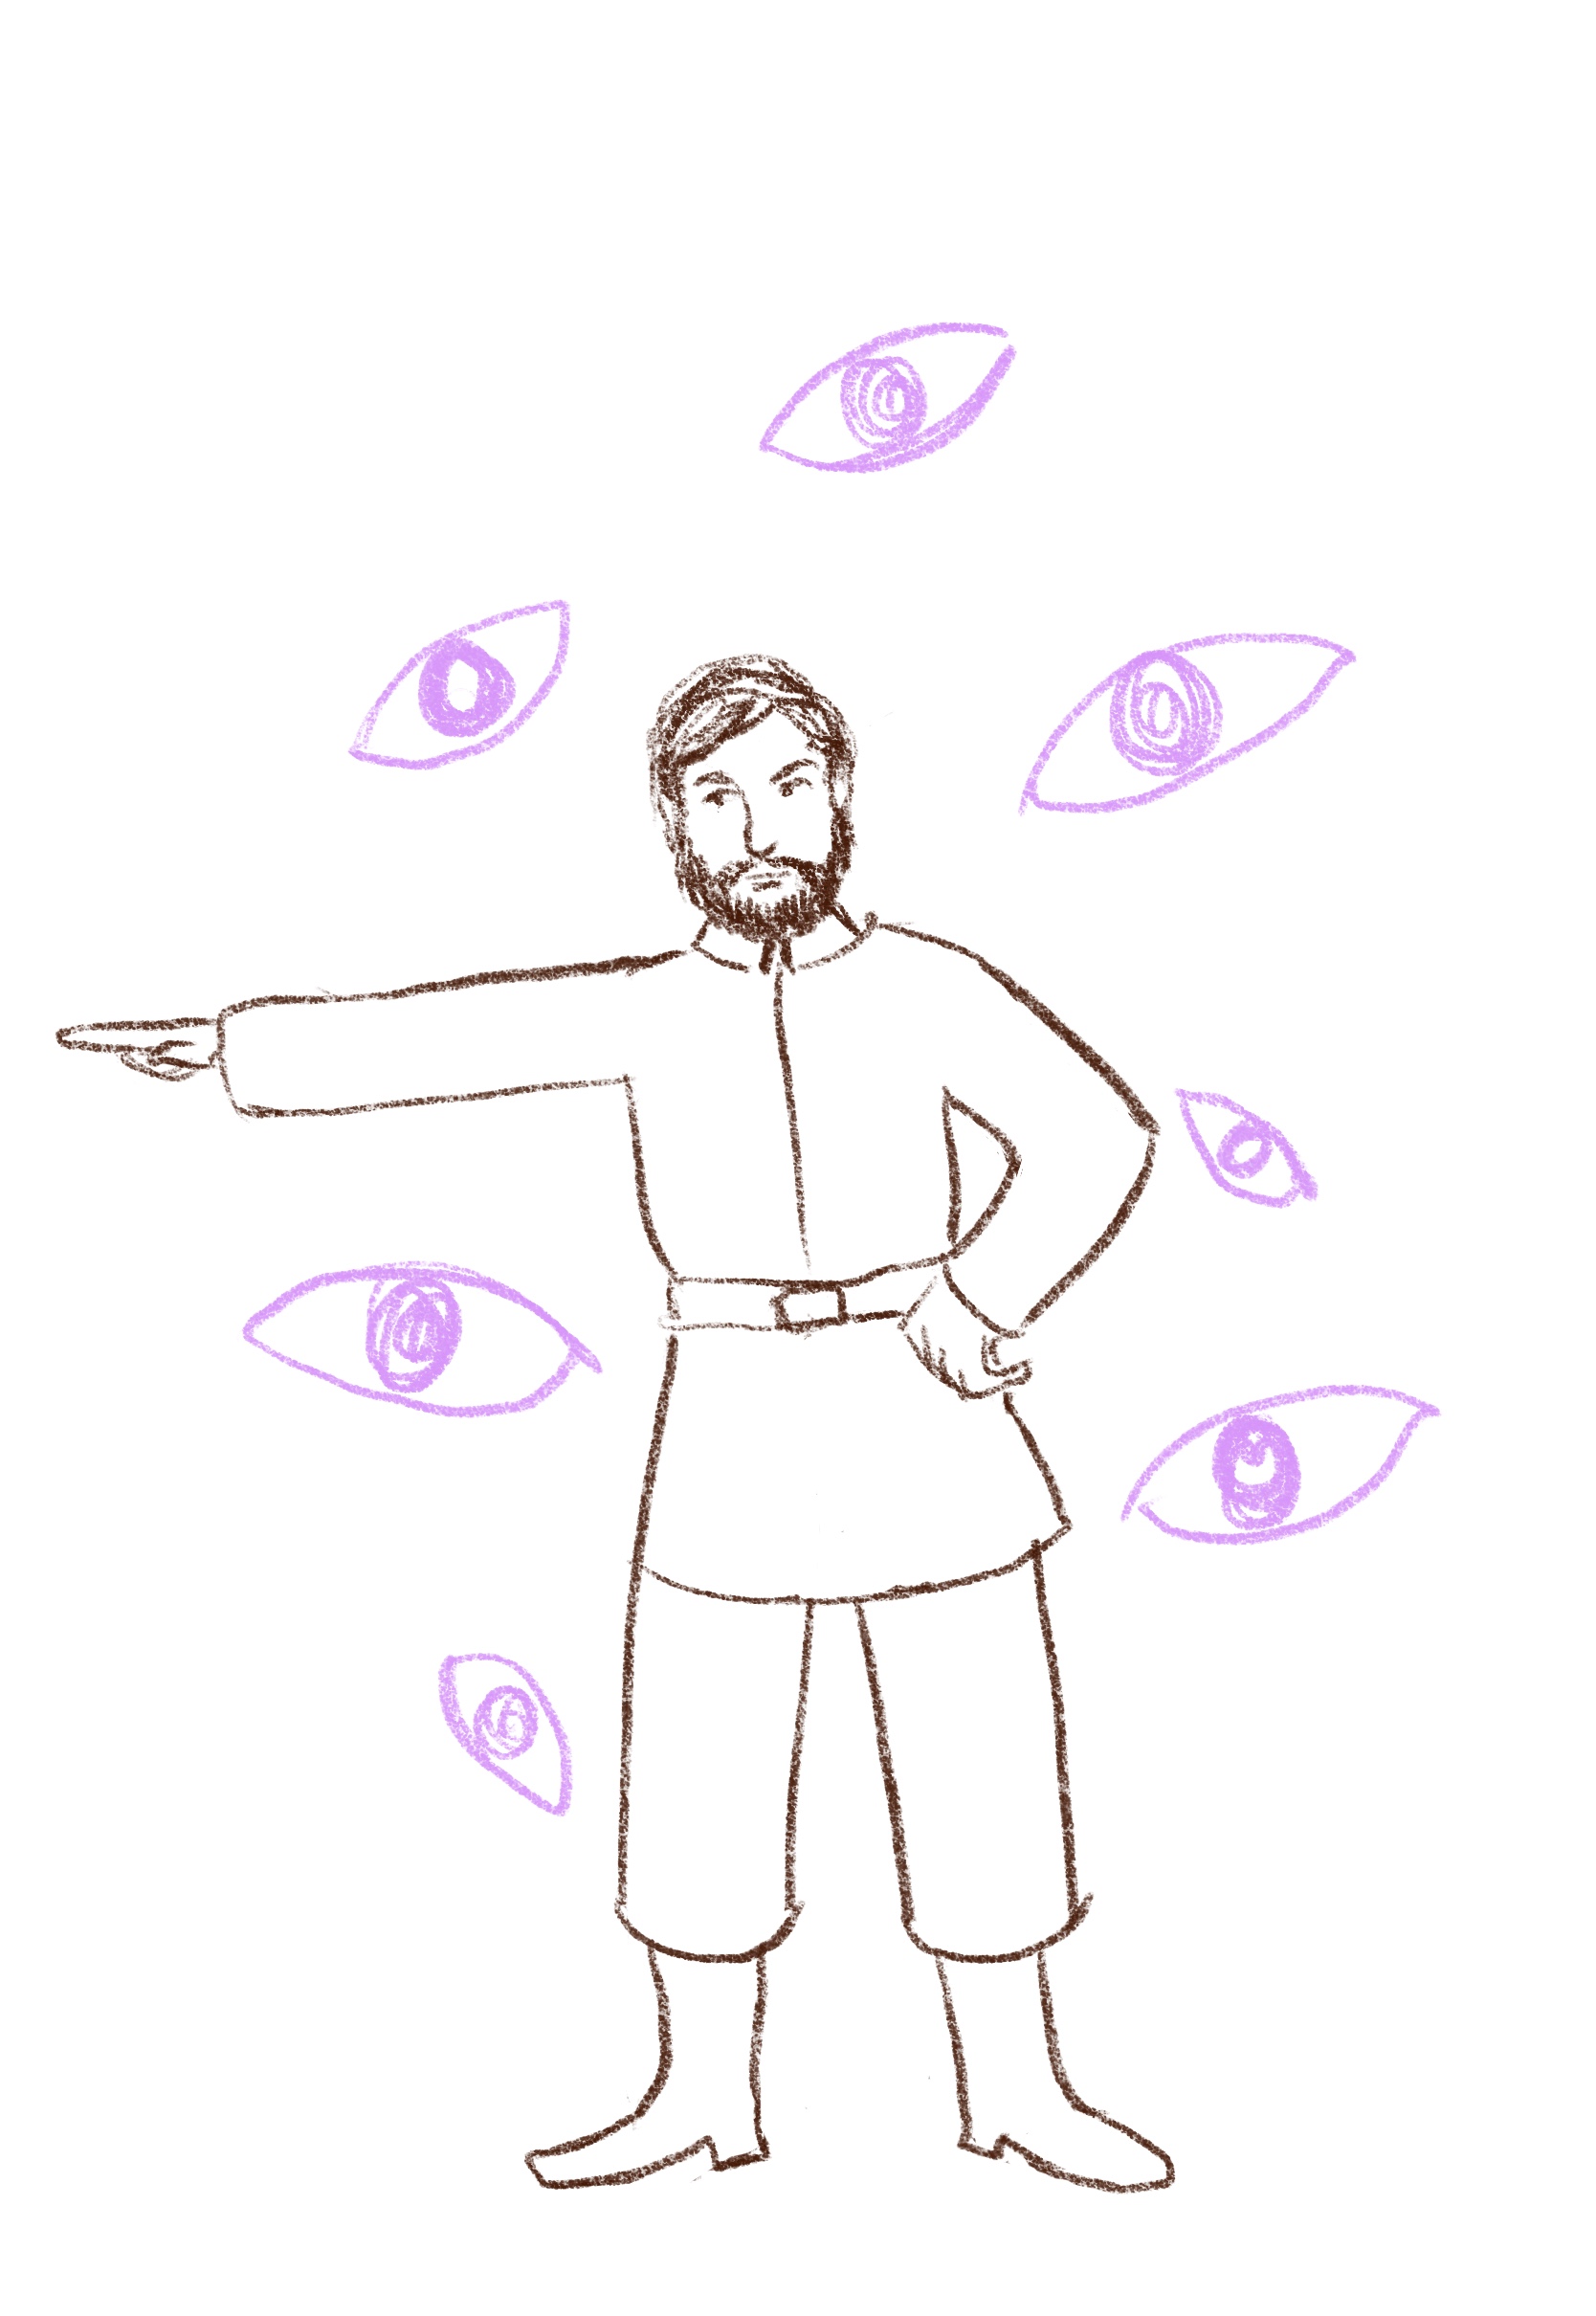
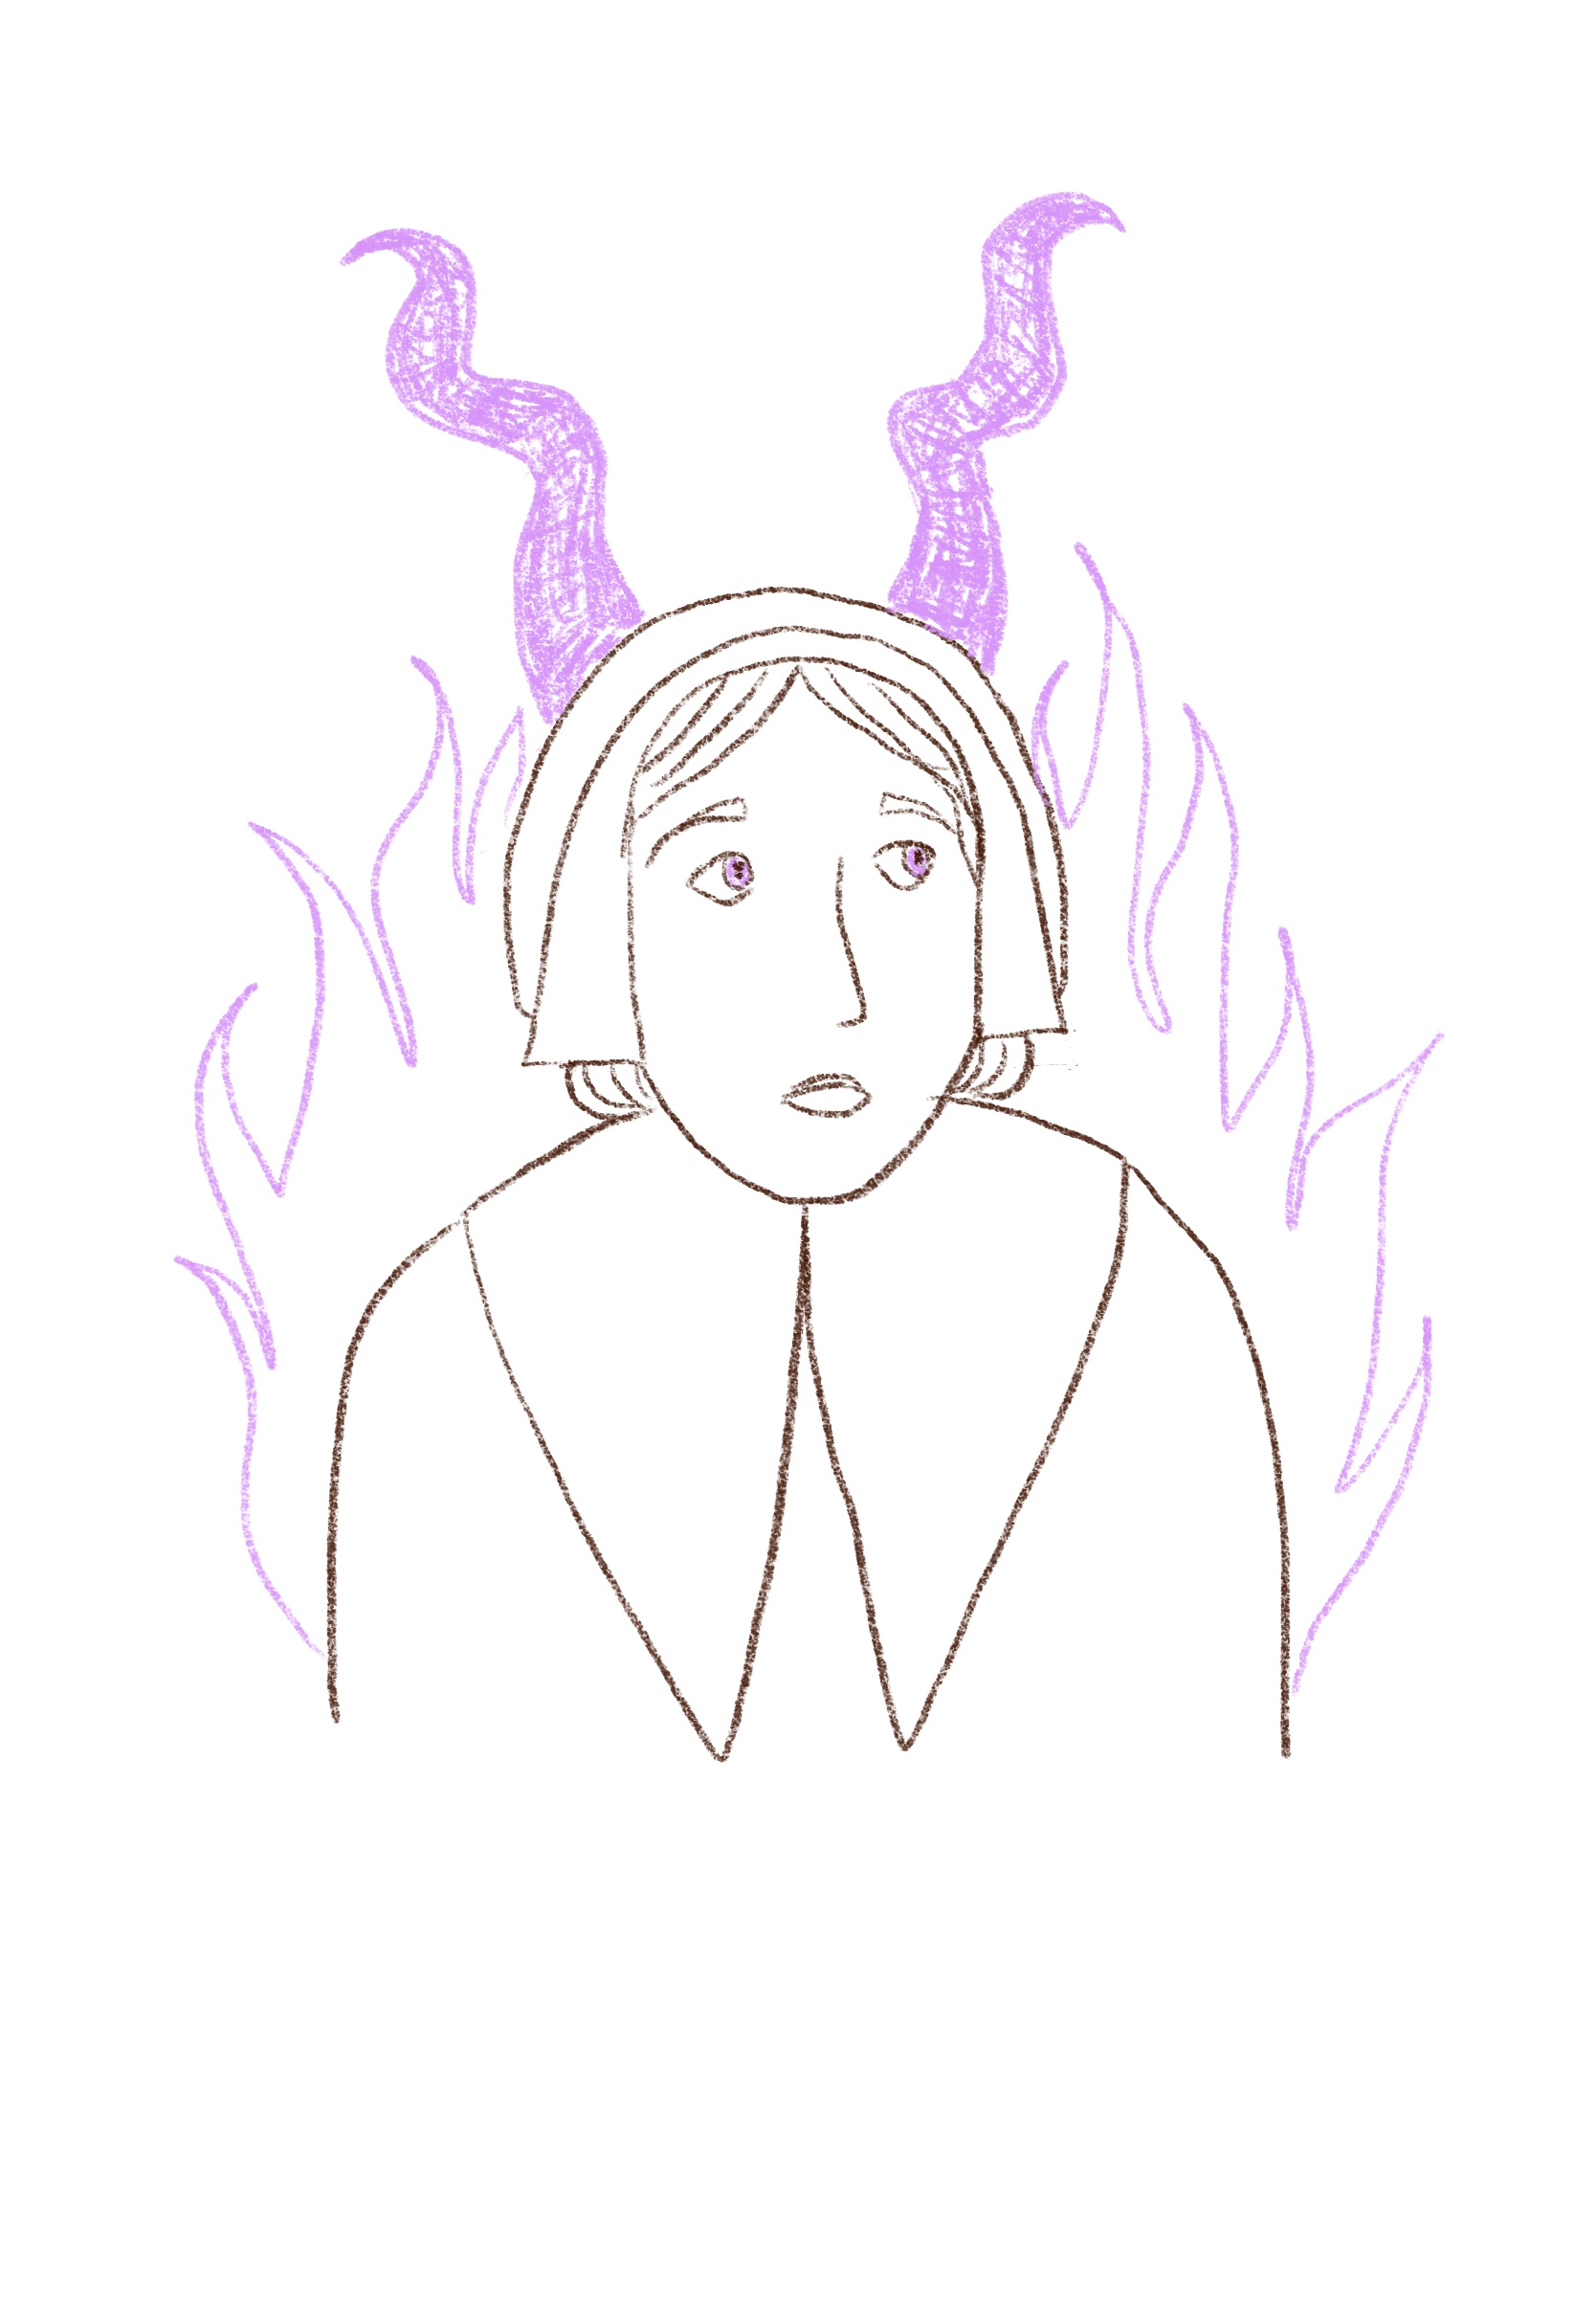
“hir Apperance most greviously torment and afflet” Rose Foster → Abigail Faulkner Sr.
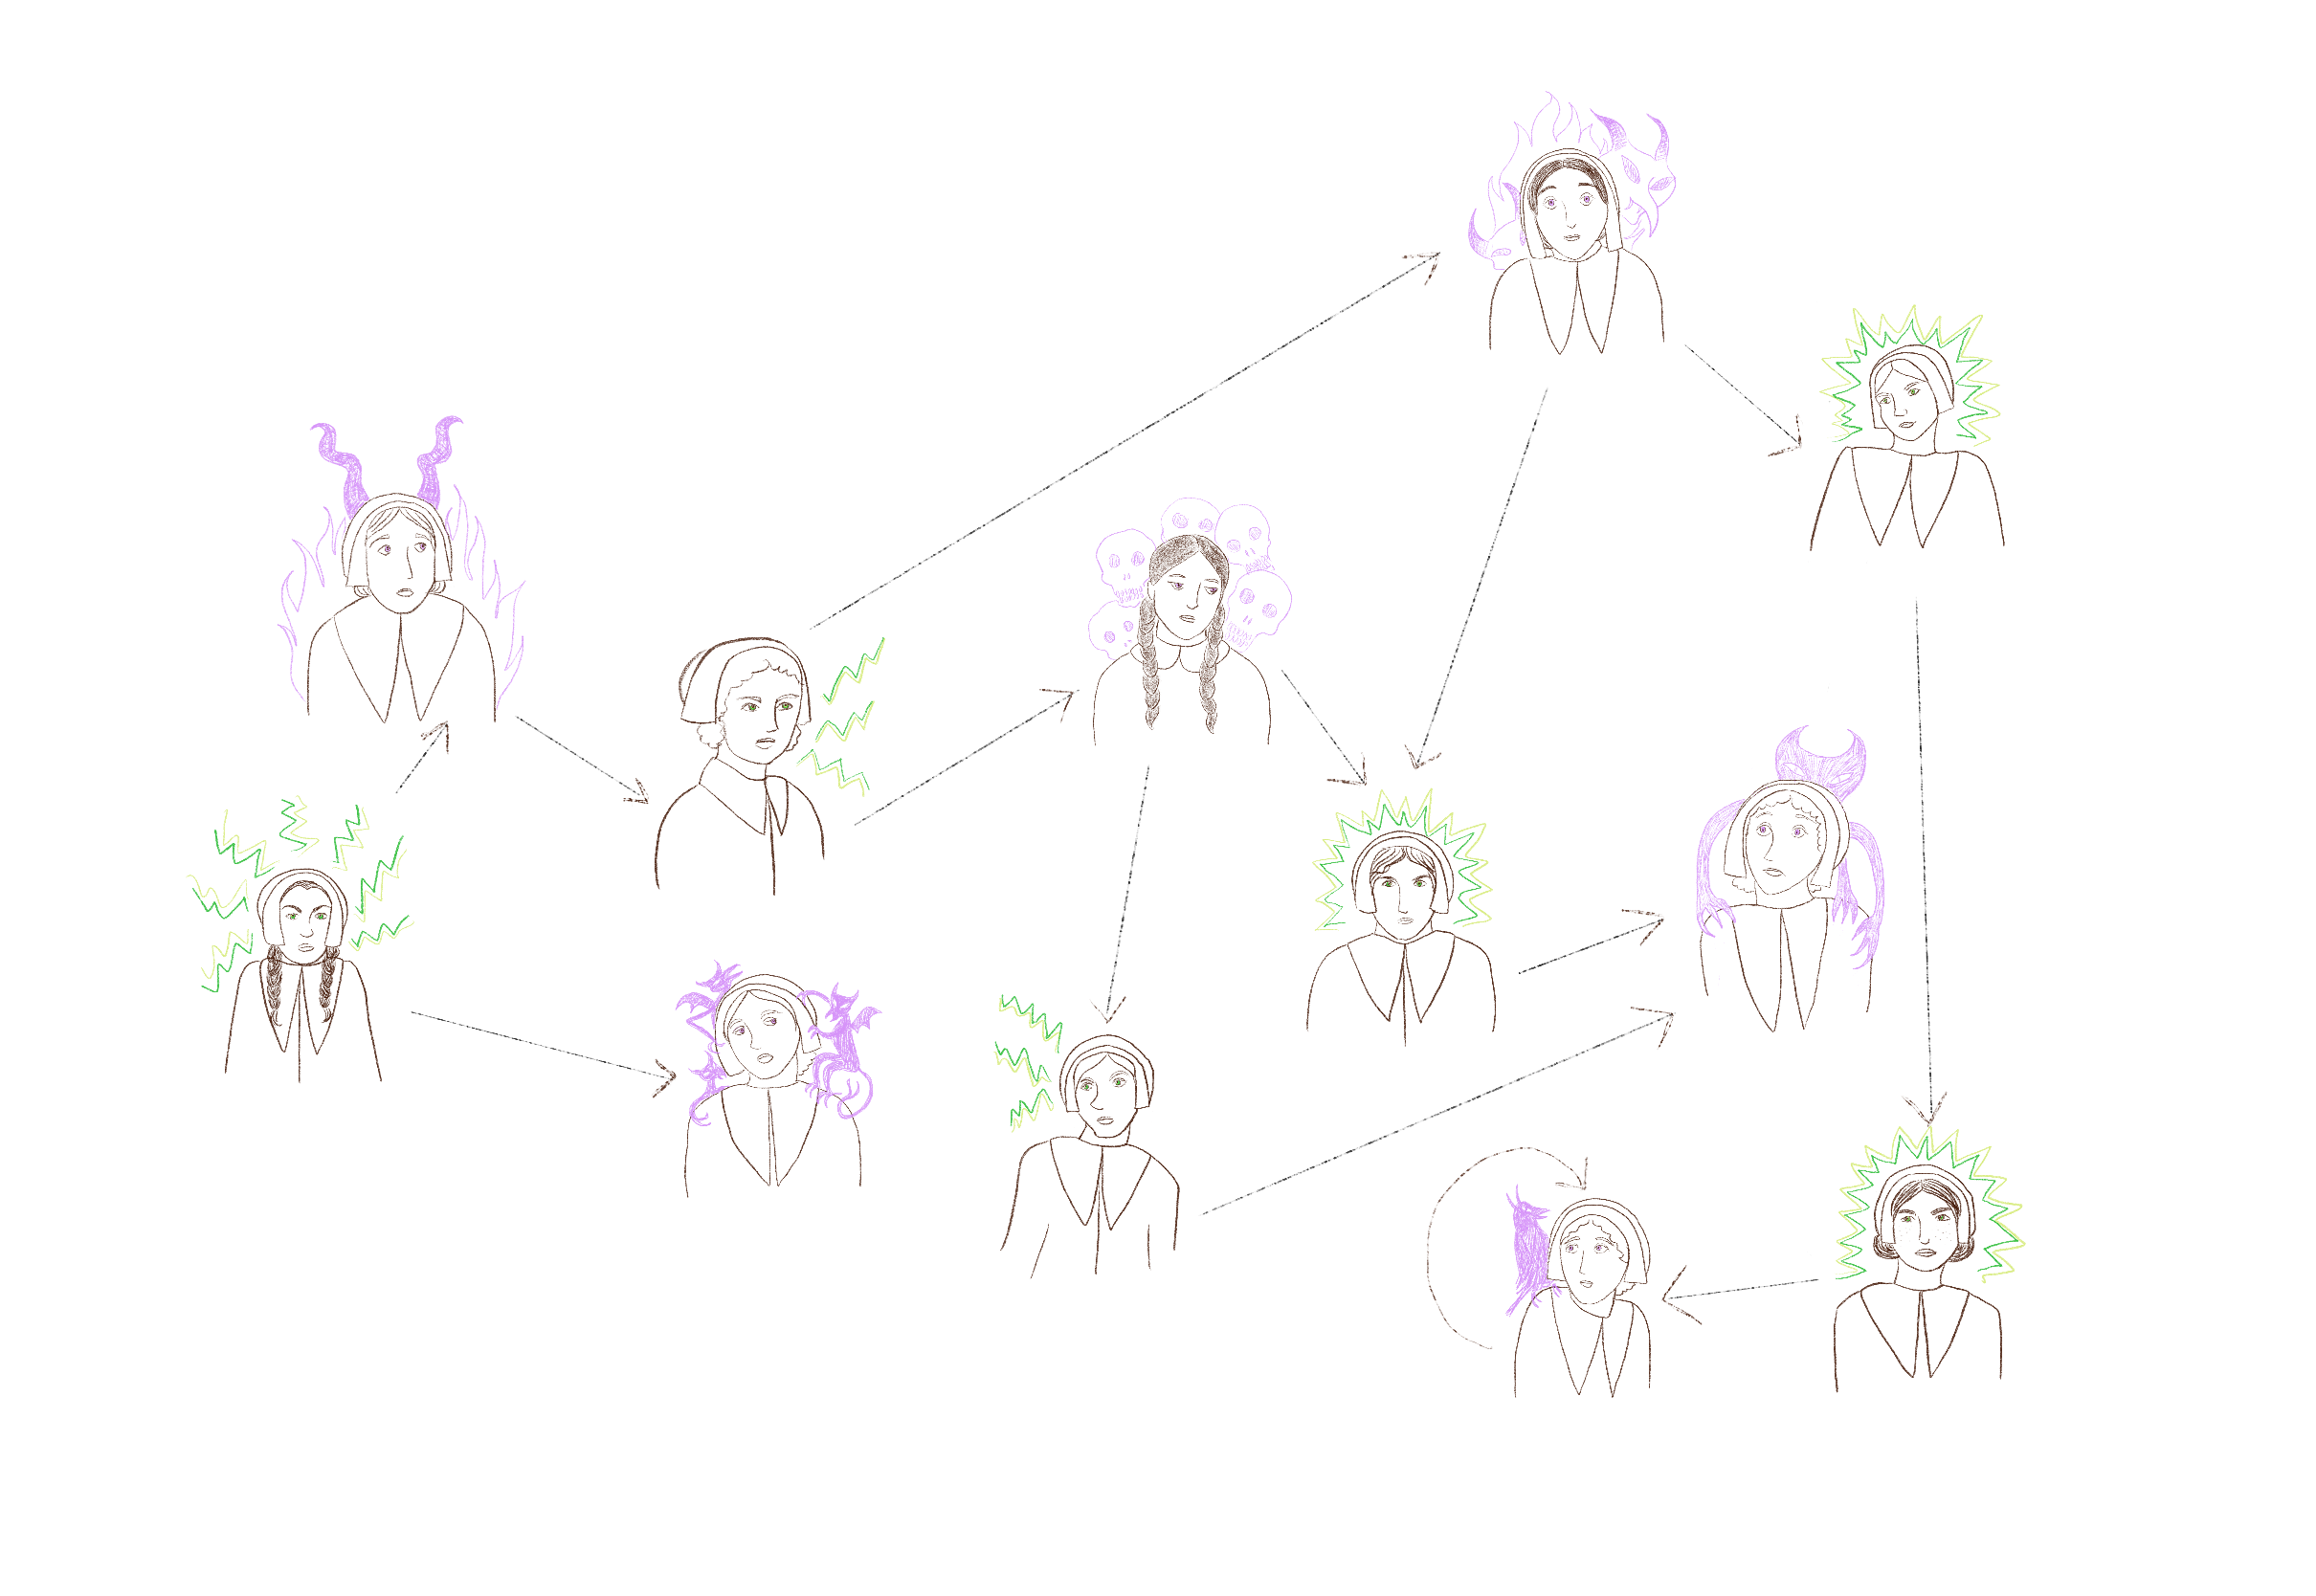
Let's start with the raw graph: all 412 people with 1,096 accusations connecting them. Each arrow runs from the person who made an accusation to the person they named, forming a directed graph of accustations between February 1692 and January 1693. The accused cluster together, the accusers fan out across them, and a few names sit at the center of nearly everything.
A handful of people threw out accustations dozens of times.
Together these six people account for 389 of the 1,096 accusations, more than a third of the entire network. This is the signature of an outbreak driven by superspreaders: a small number of sources carrying most of the transmission.
A contagion spreads outwards, but also recruits into the network. Highlighted in red are 51 people who "switch sides" or get infected and pass on the contagion. These are often accused turned accusers. Accepting the story, confessing, and passing guilt to others in an attempt to save their lives. Among them are Tituba, Mary Warren, Abigail Williams, and Martha Corey.
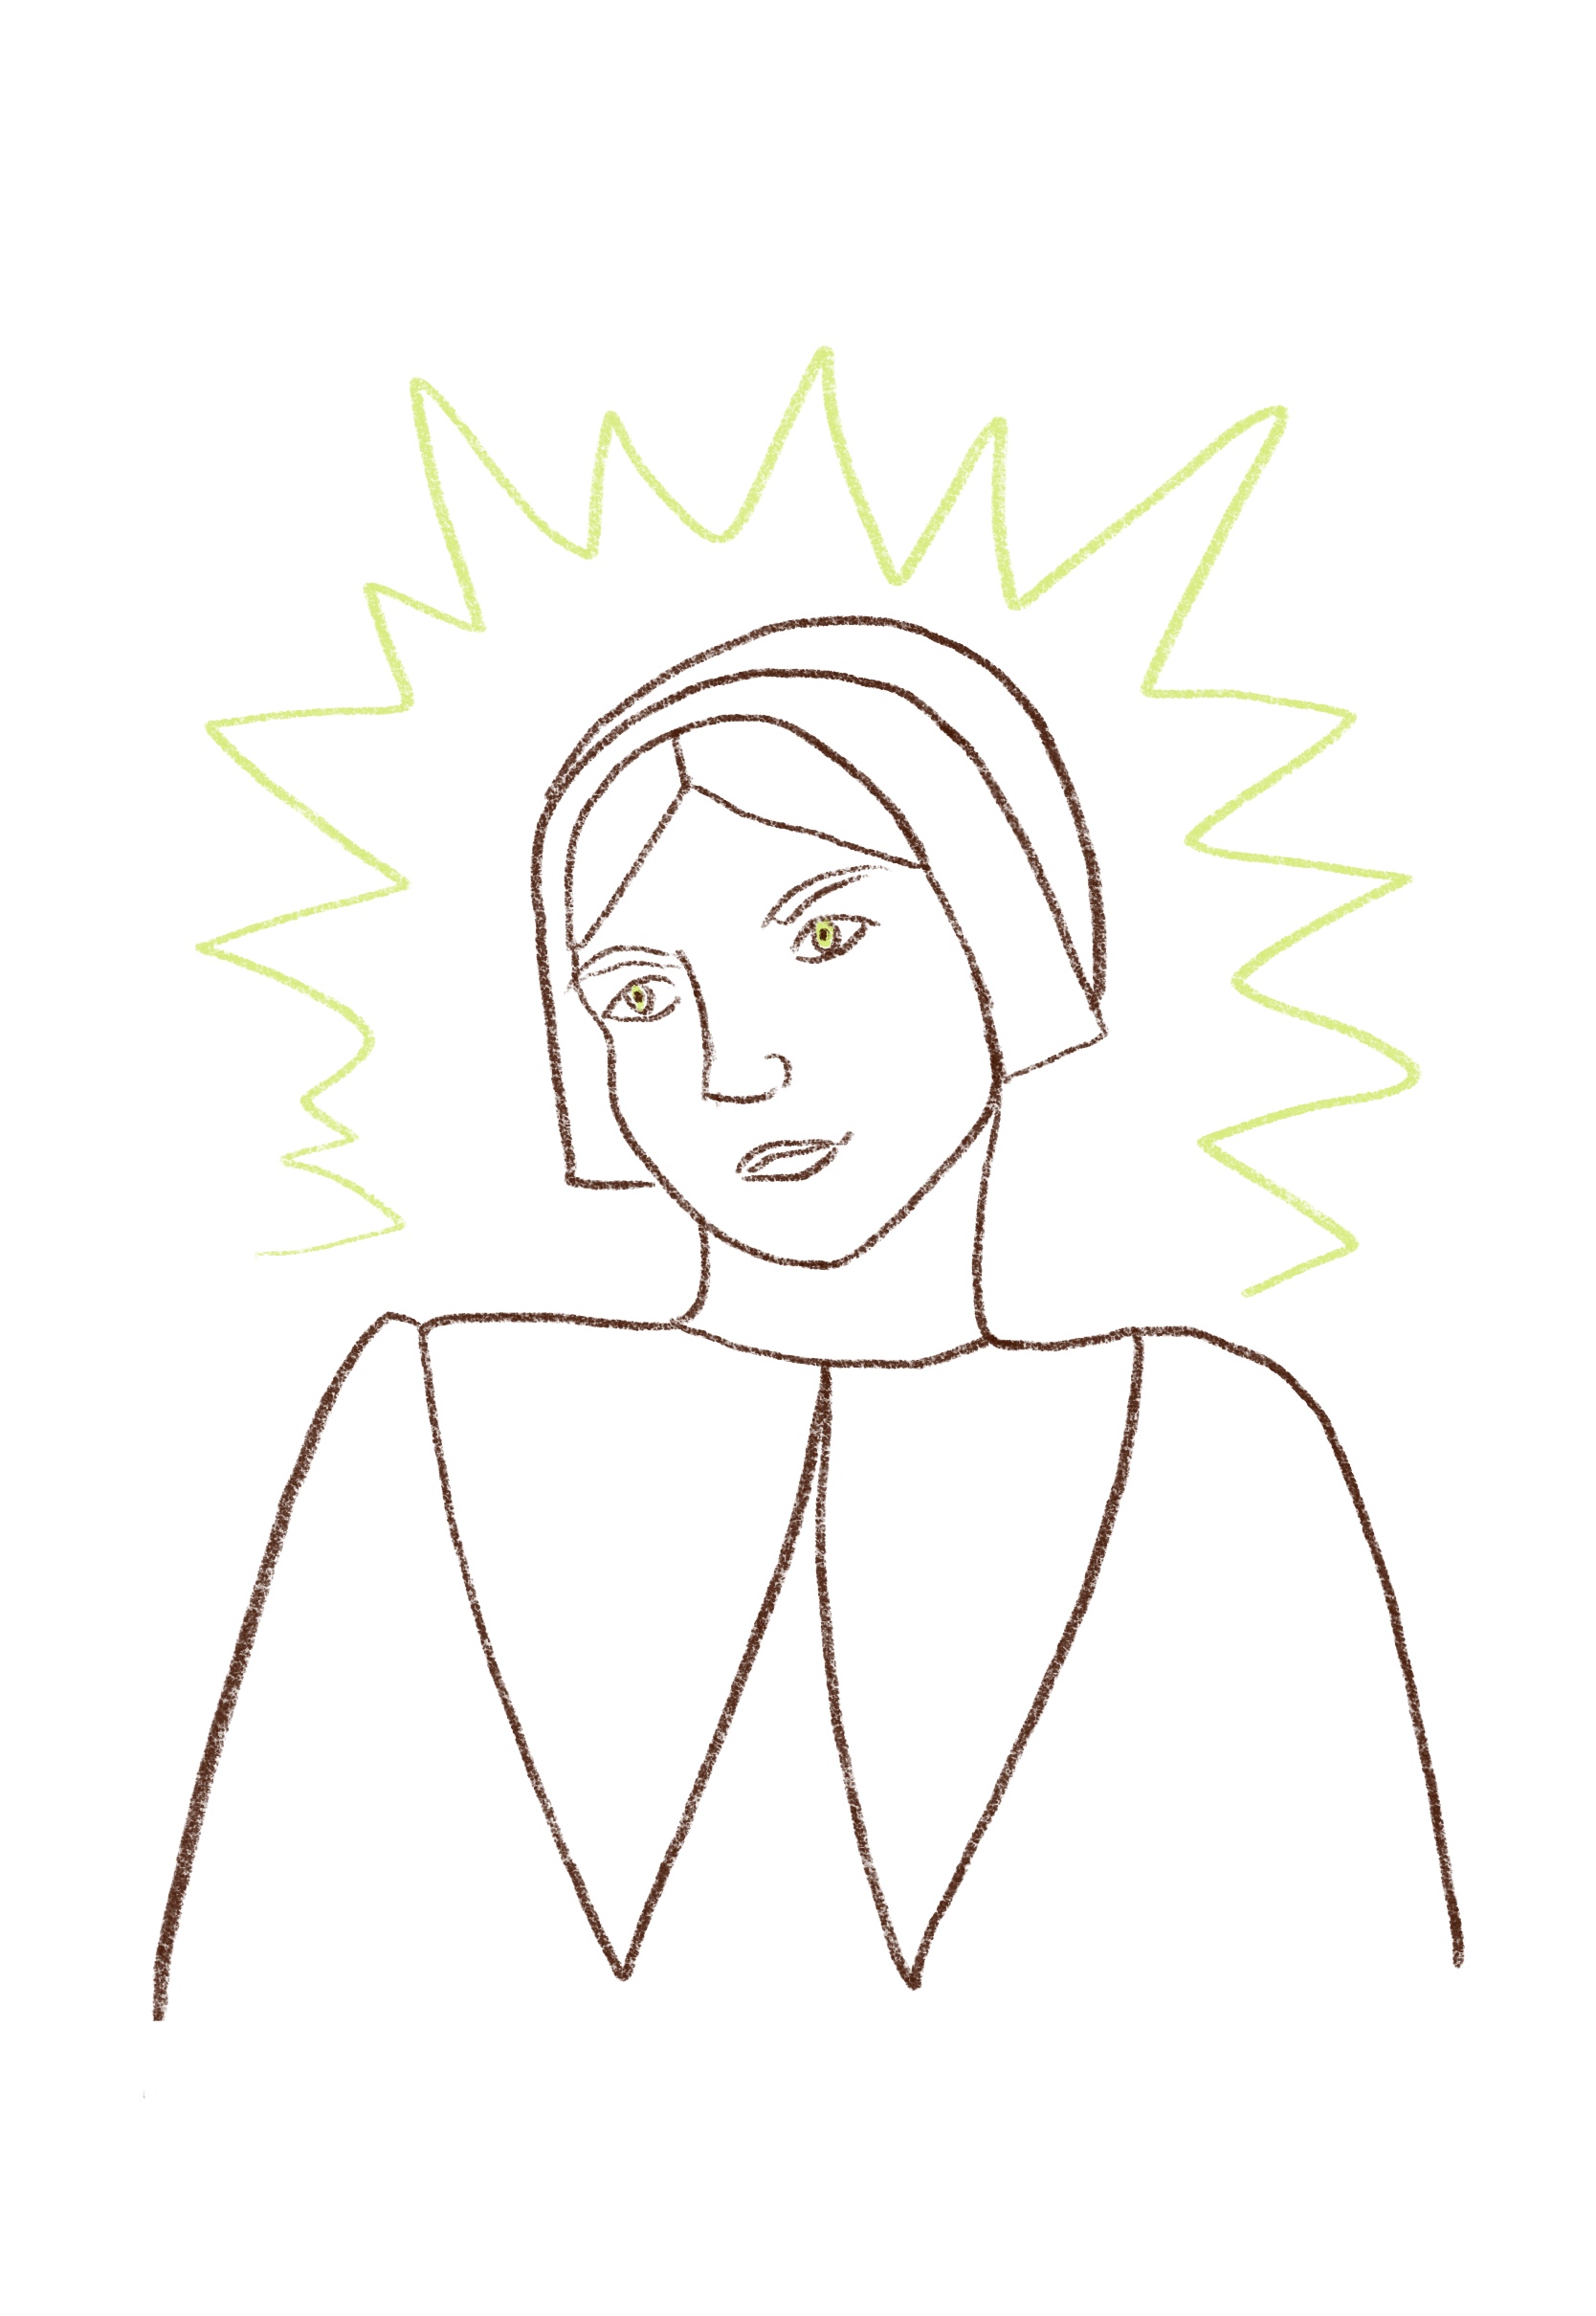
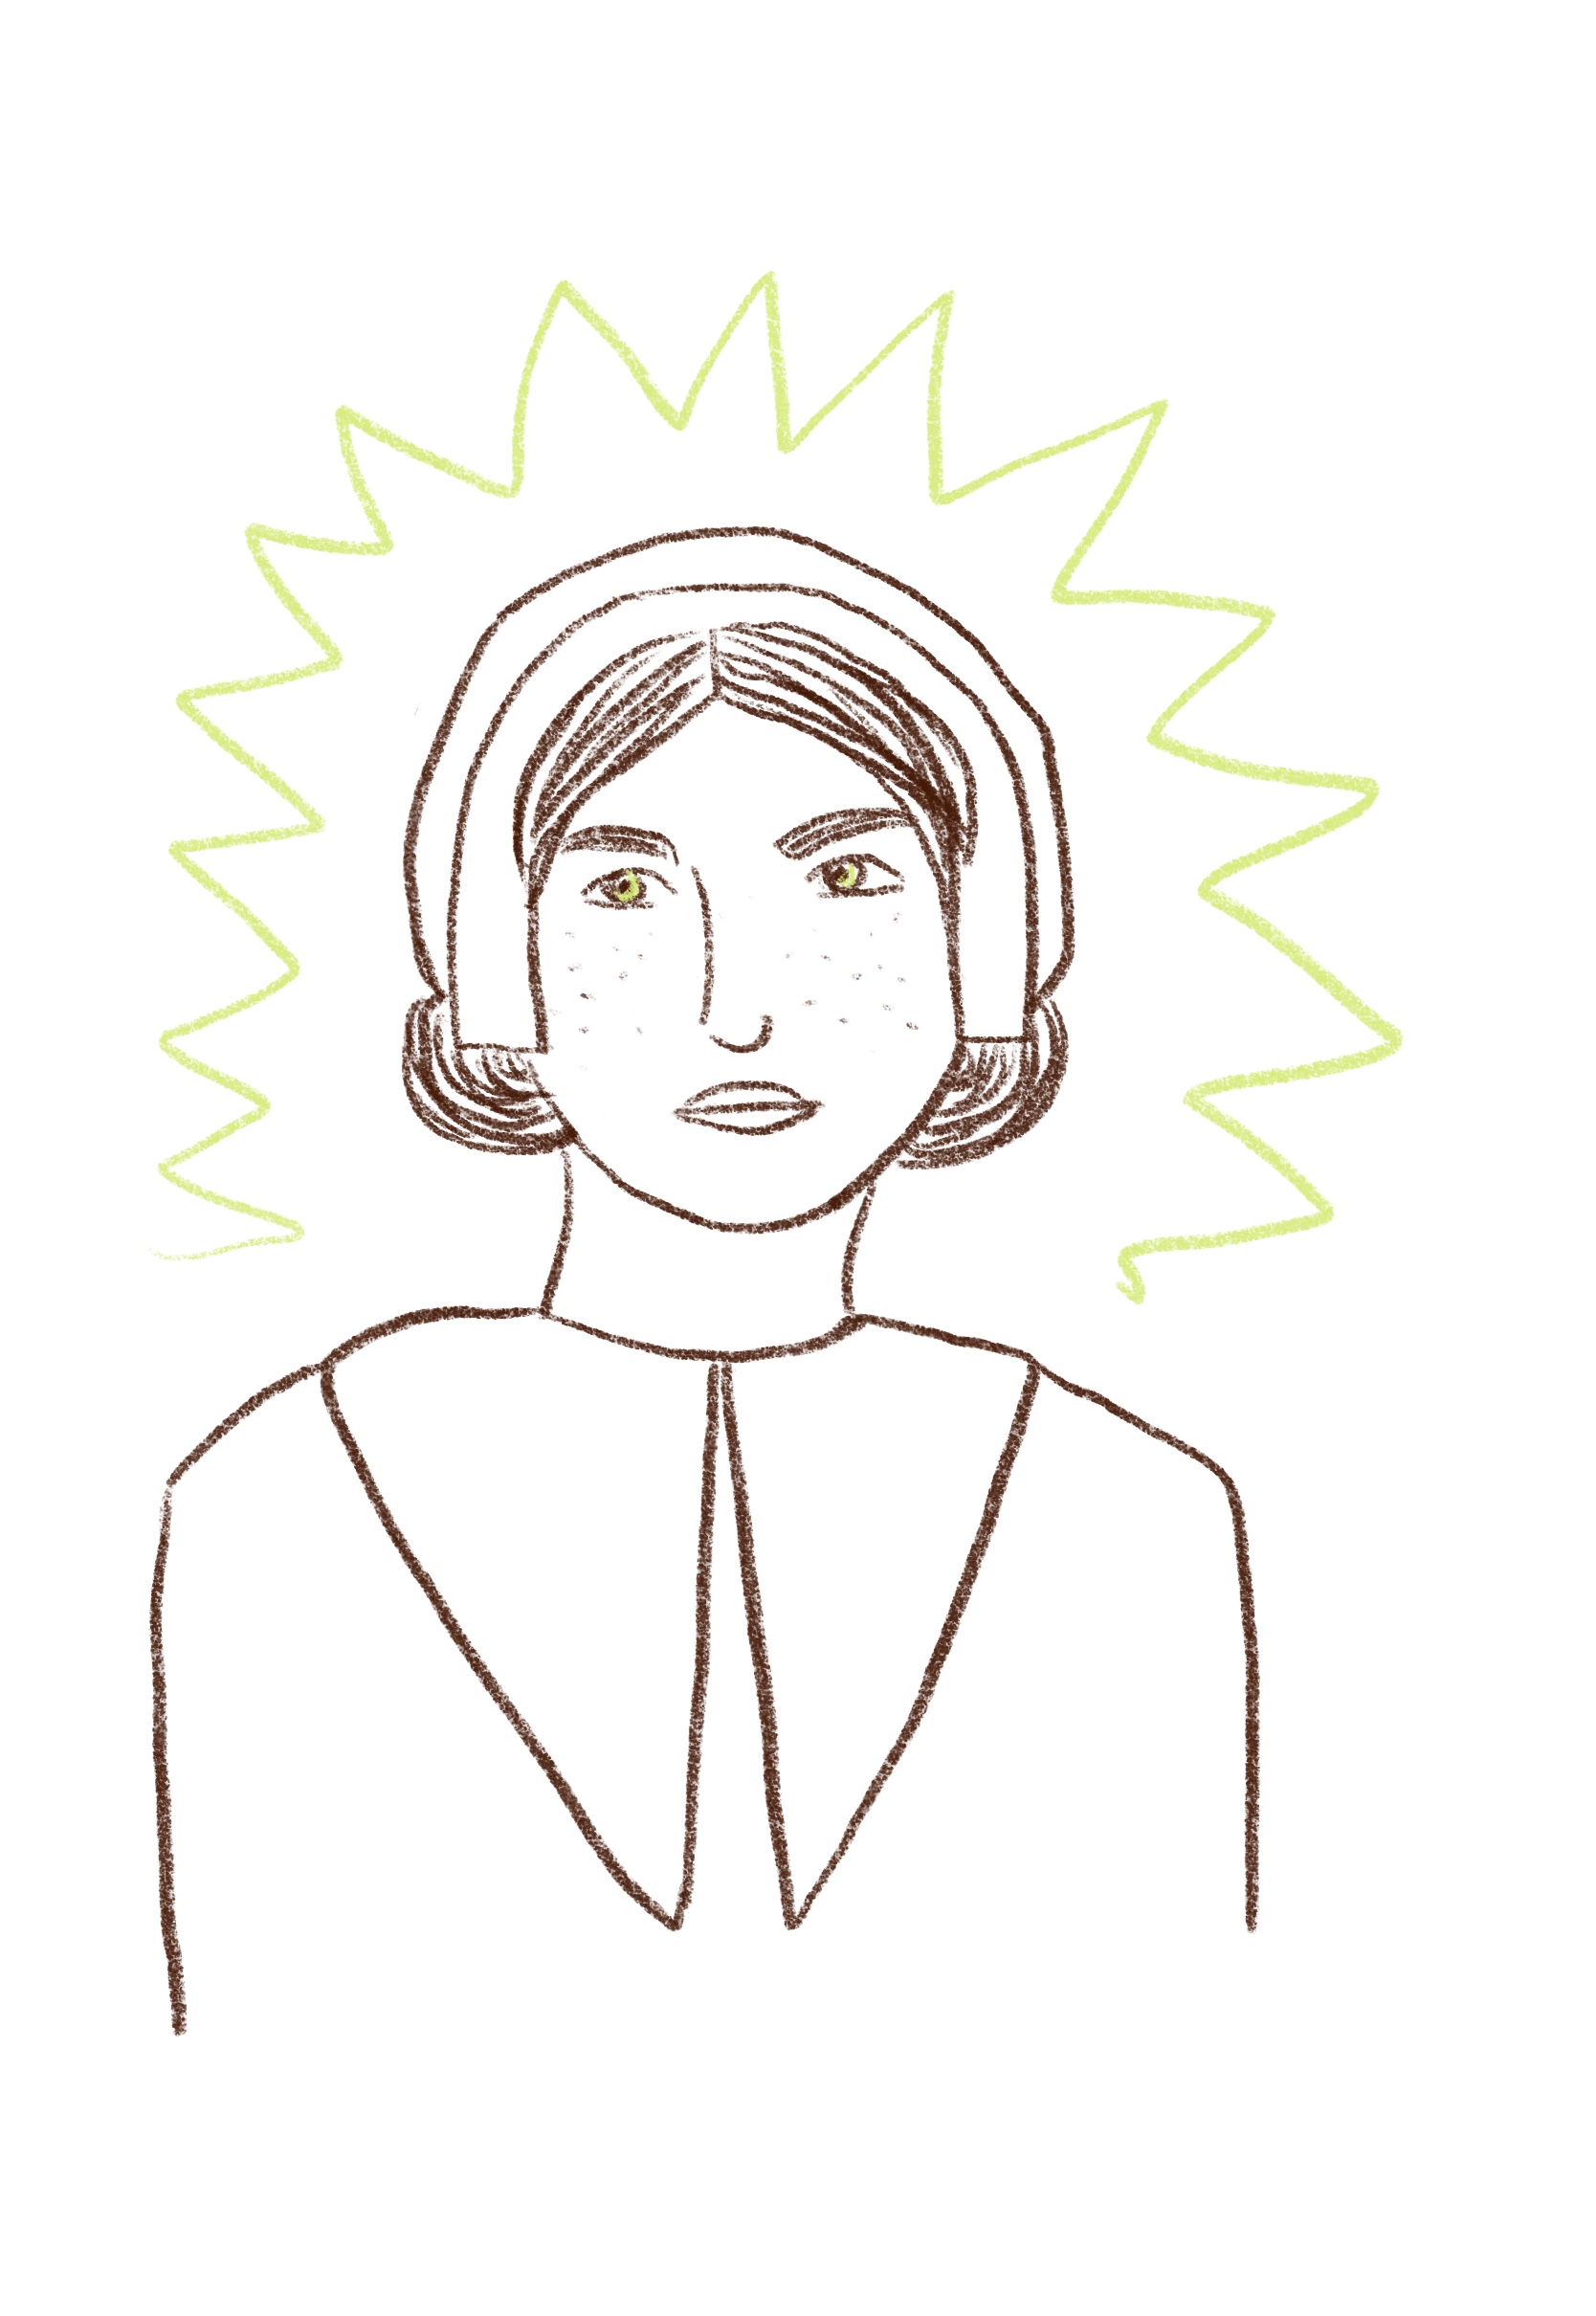
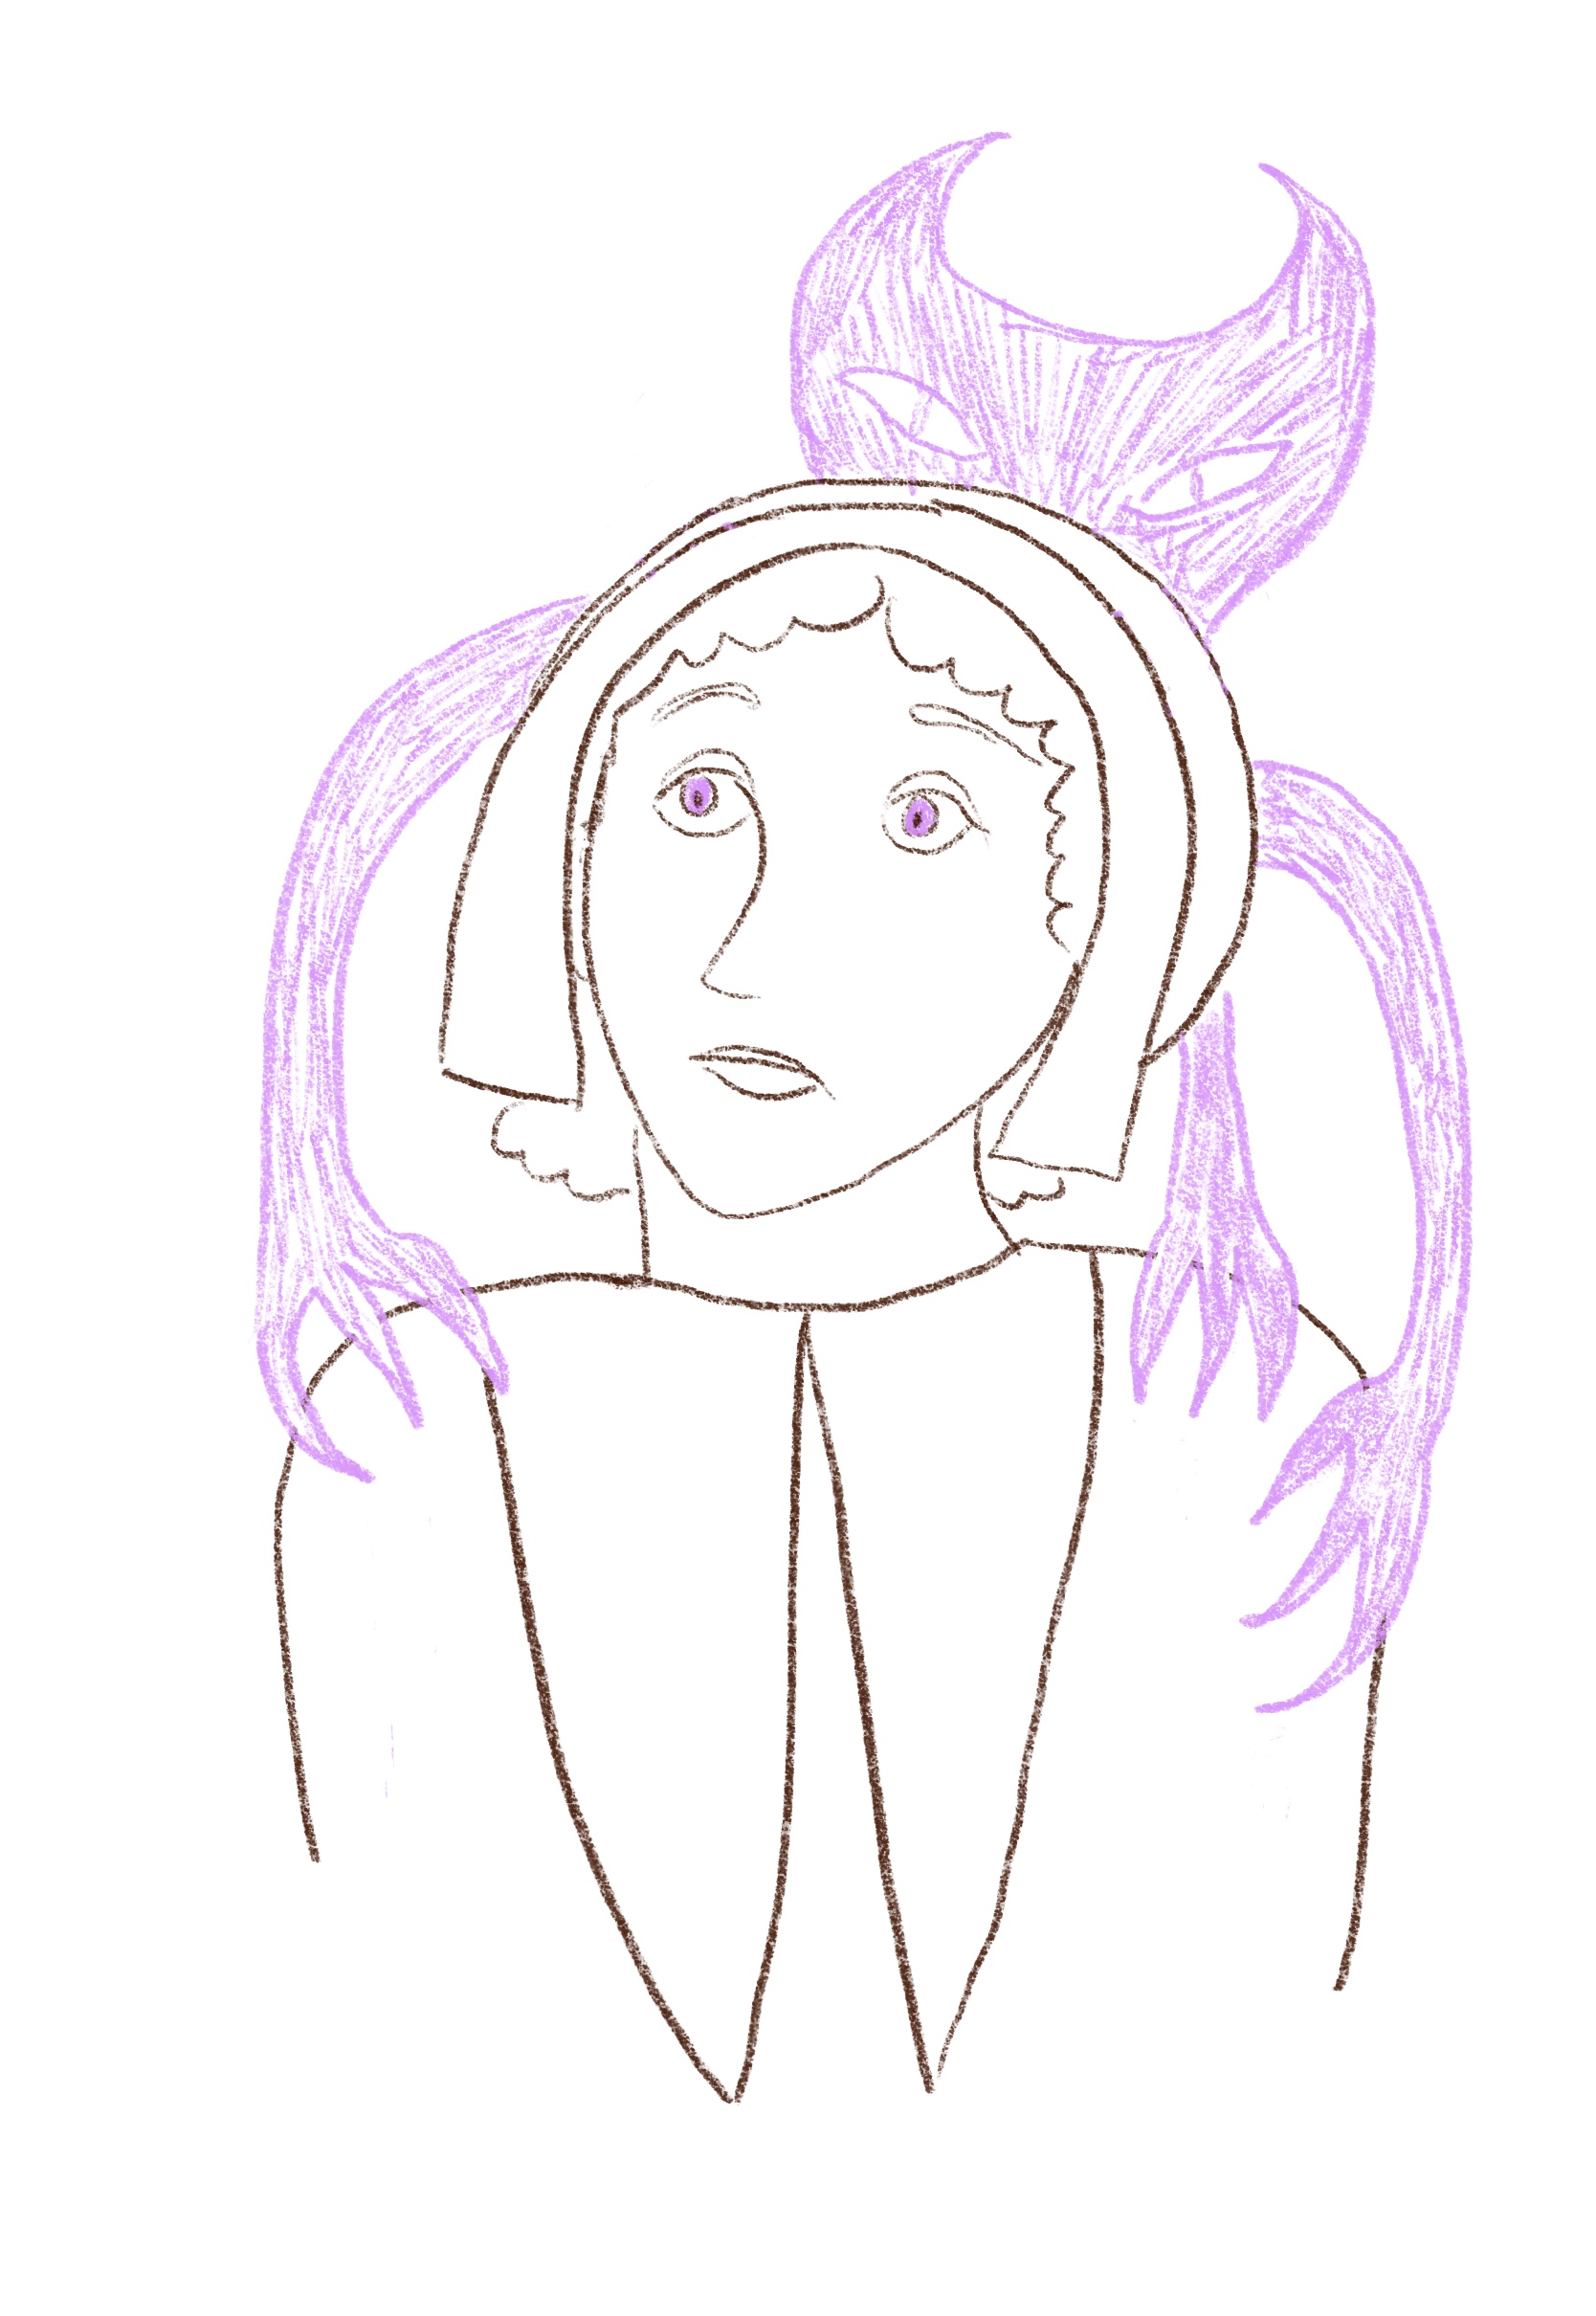
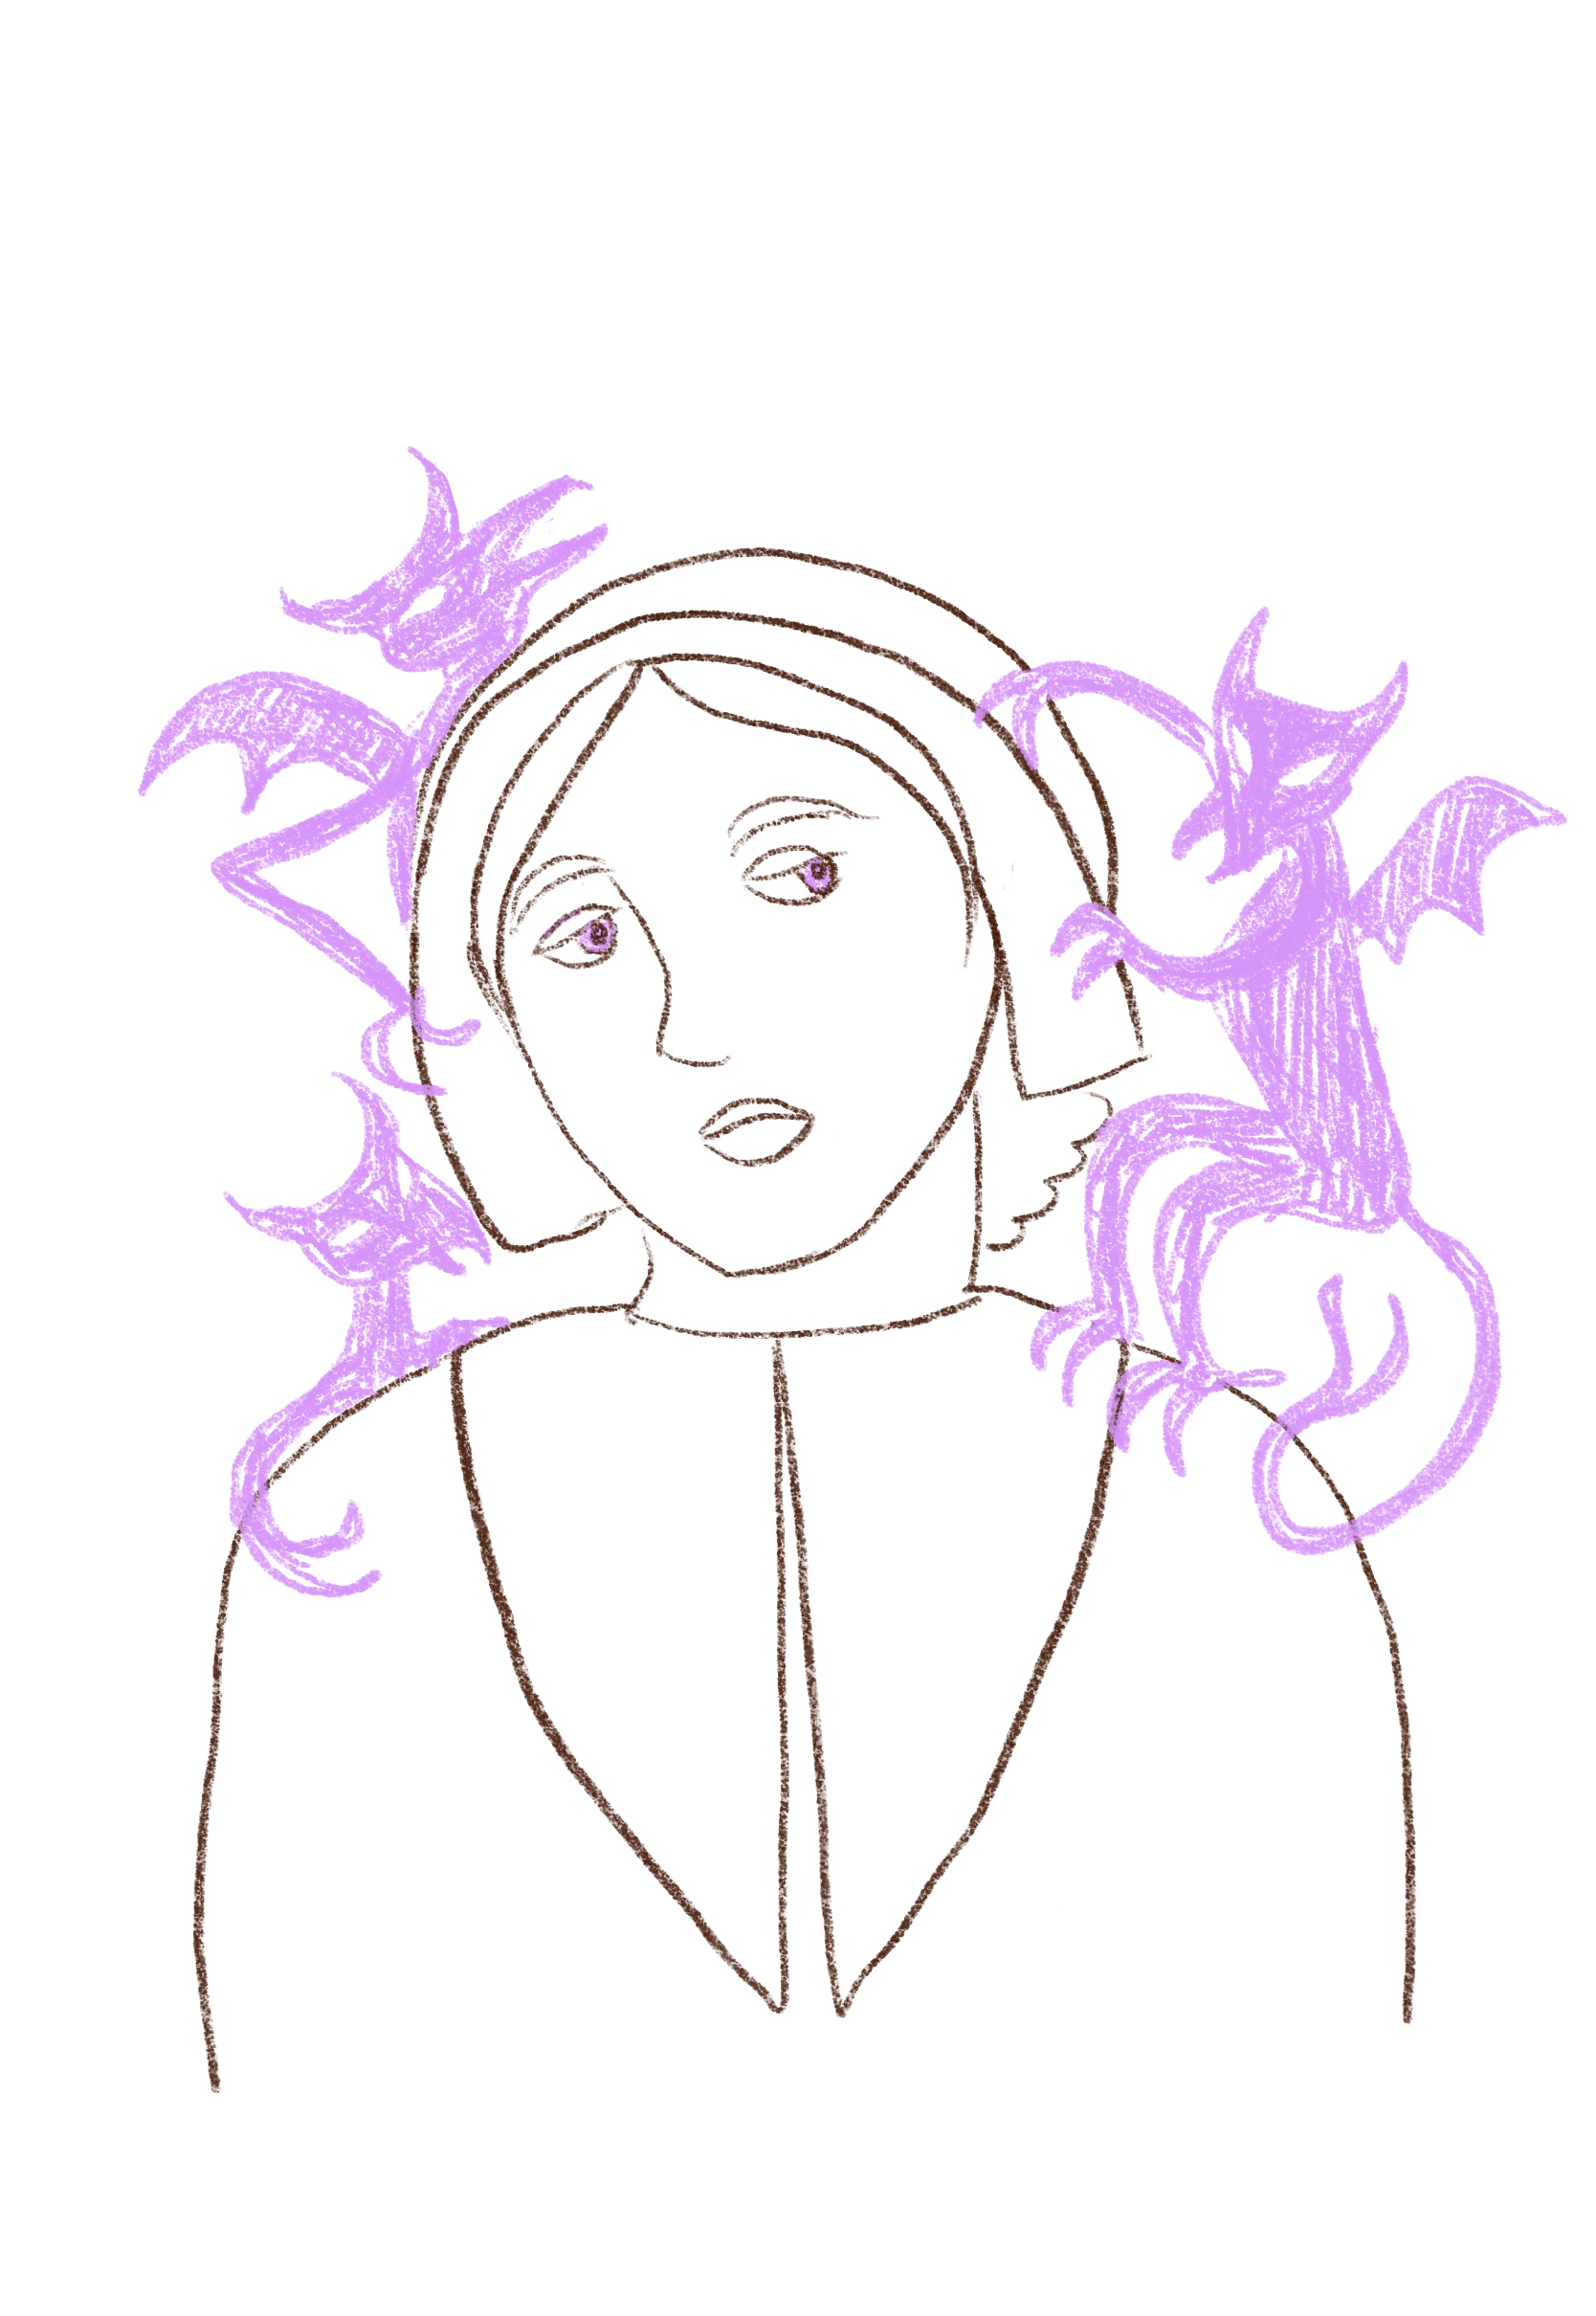
The record even names the mechanism. 95 accusations describe the same act of signing the Devil's book. The network recruits from within its own victims, which is exactly how a spreading process replenishes itself.
There is one defining characteristic of this network worth noting: the network has no loops.
Follow any chain of accusations and you can never find your way back to where you started. The only exceptions are five people who appear to themselves — the accused seen in their own dreams — drawn here as small rings. Apart from those five, there is not a single cycle in all 1,096 accusations.
Laid out by generation, the shape is unmistakable: 267 pure accusers at the root, accusations passing downward through as many as five steps, always onward, never back.
A network with no loops but with a recruitment step is precisely what a witch-recruitment network — or an epidemic — looks like. There is no way for the "infection" to cycle back on itself; it only moves forward to new people.
And that is what makes this interesting. Because the structure is a contagion, we can fit classic epidemiological models to the data — the same models used for the spread of disease.
The curve of an outbreak
If the accusations behave like a contagion, they should leave a contagion's trace in time. Here is every one of the 1,096 accusations, dated to the month it was made.
Each bar is one month of accusations, from the first in February 1692 to the last in January 1693. Watch the outbreak accelerate through the spring.
It crests in May 1692, when 290 accusations are made in a single month — the high-water mark of the crisis.
Then it falls away through the summer — until a second wave breaks out in the nearby town of Andover during August and September, with 174 and 183 accusations respsectively. Outbreaks rarely end in a straight line.
This is the shape epidemiologists know well: rise, peak, decline, resurgence. Read together with the loop-free network underneath it, the Salem record stops being a local tragedy and becomes a case study in how things spread — one that classic epidemiological models are built to fit.
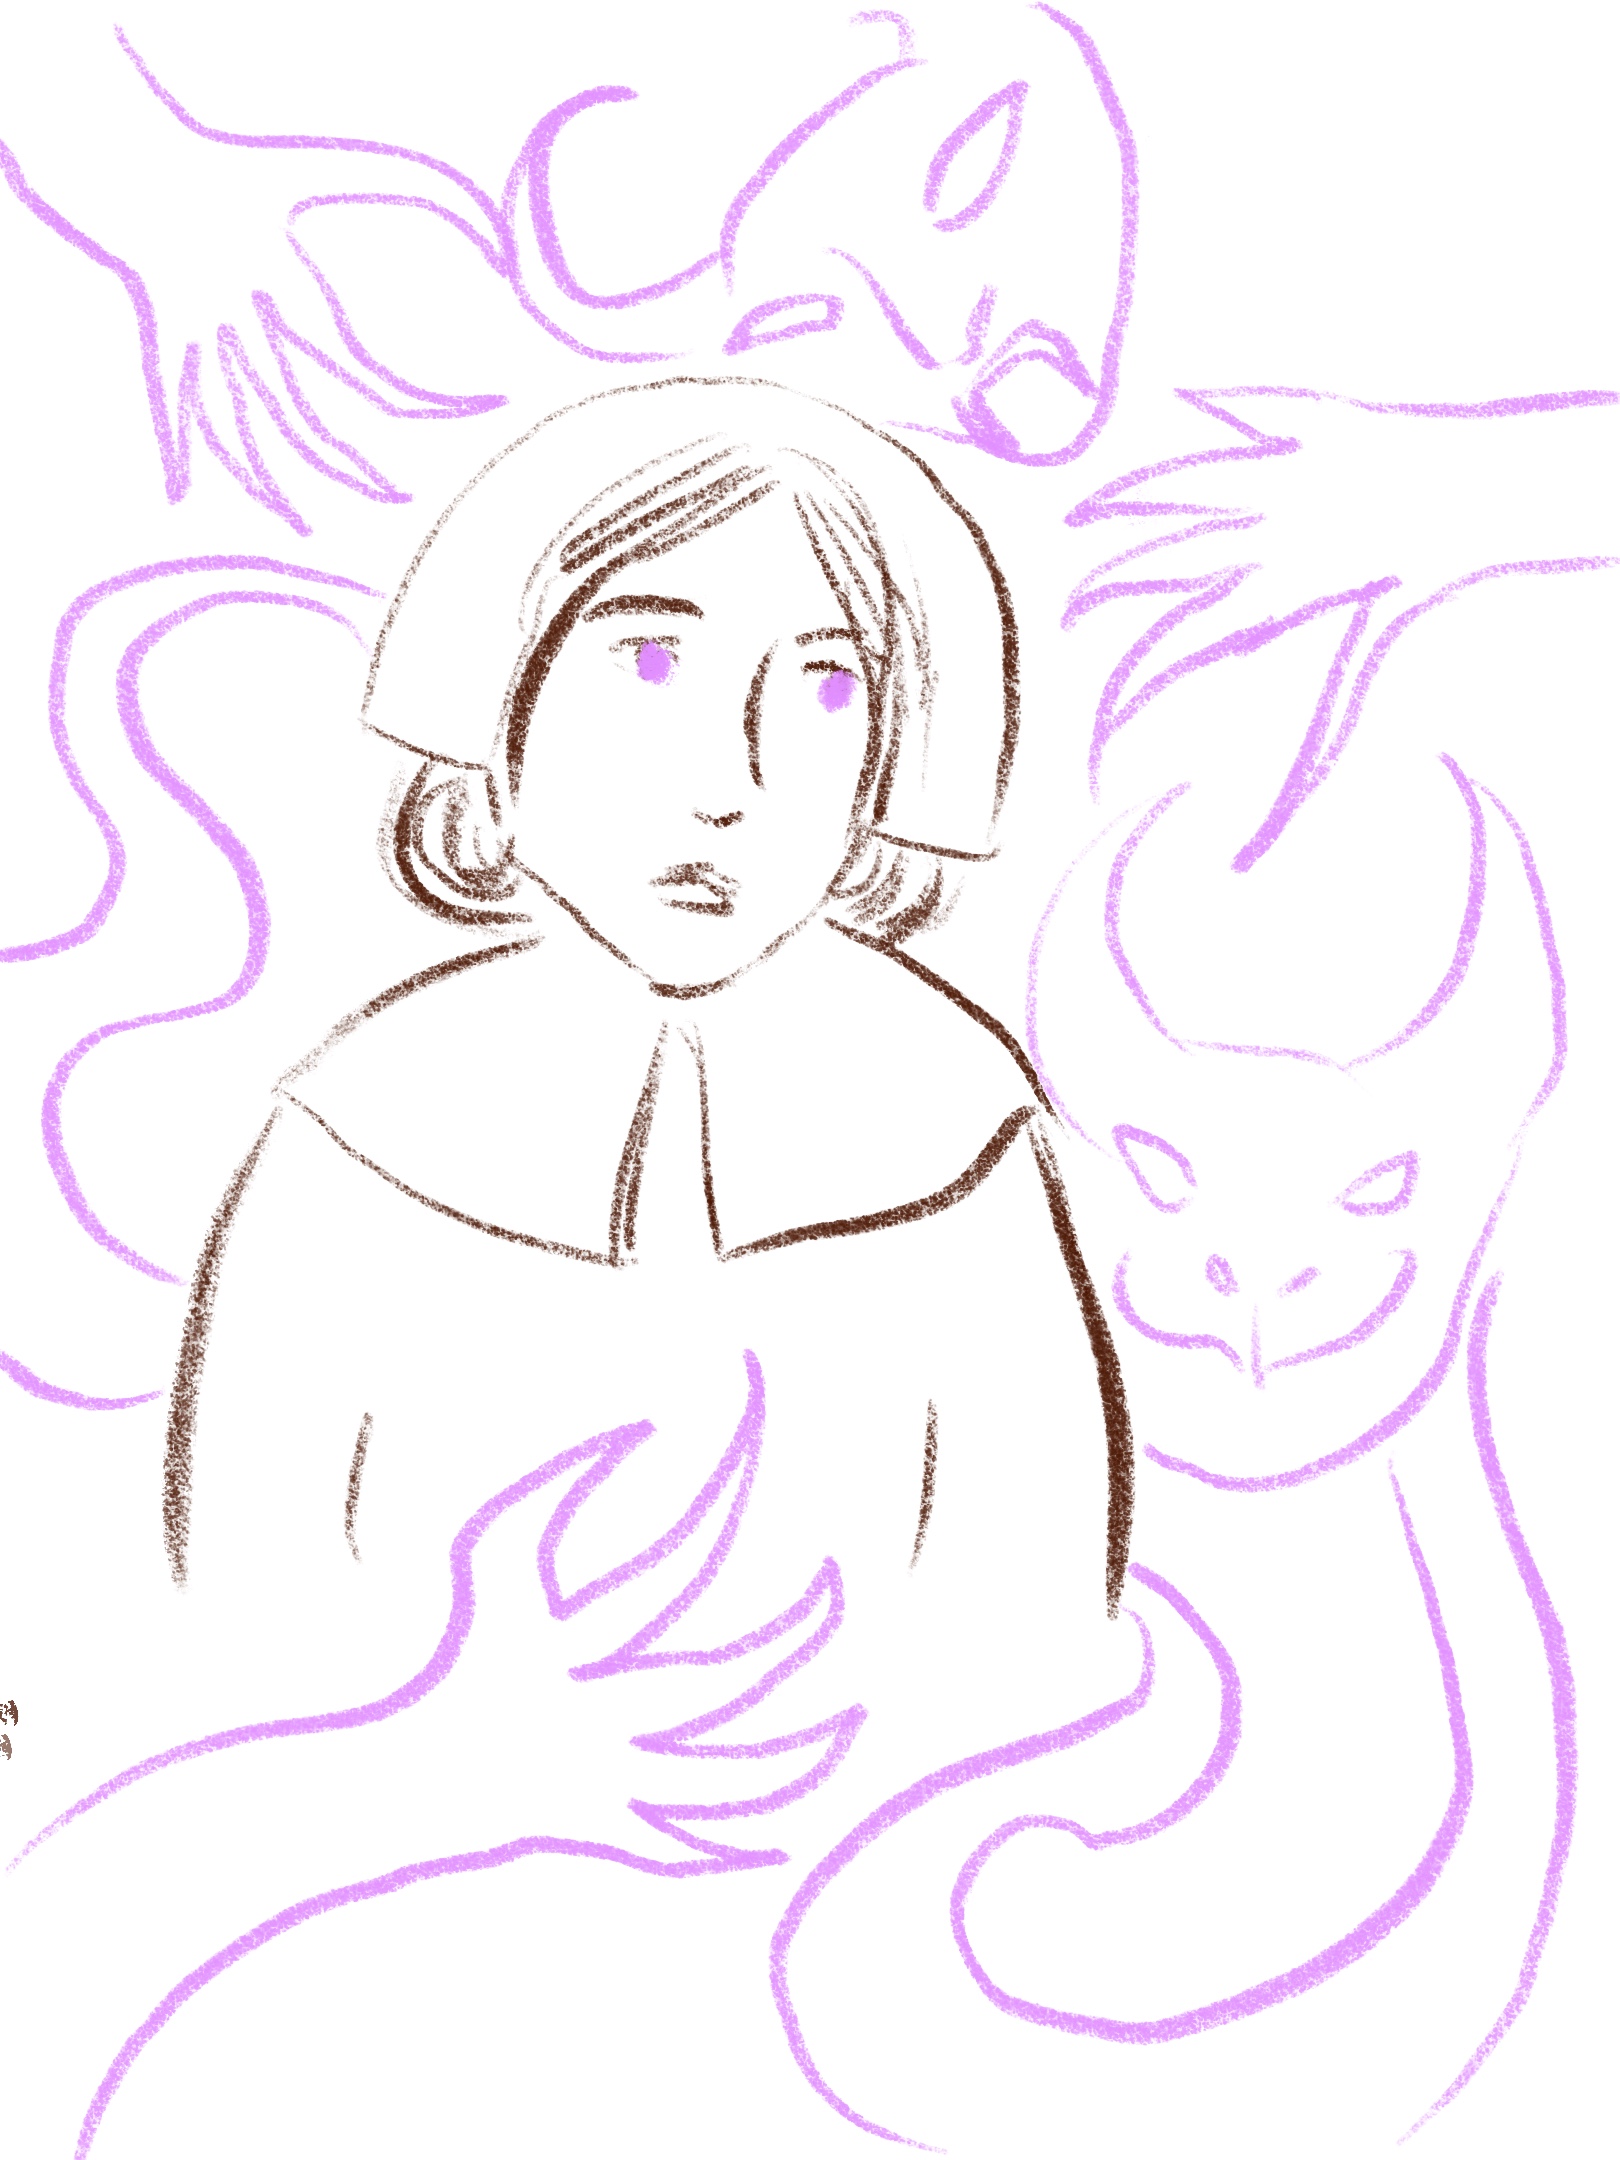
When taken together, a set of courtroom accusations from 1692 can be analyzed with the mathematics of contagion. What looks like a tangle, on inspection, is a network pointing in exactly one direction. But how did it get that way? Why did the accusations spread like a disease, and why did they leave no loops behind?
It could be that courts had to record the story as consistent with a contagion so that the narrative in the public record "made sense"; or it could be that people filtered themselves to tell a story consistent with previous statements so that their accusations would look believable.
Or maybe, it always was an actual contagion... of witchcraft or of beliefs in witchcraft.